Case Study
Direct marketing optimization
Achieve even higher completion rates, with response forecasts for campaigns.
Communicating the right offer to the right customers, be it by e-mail, telephone, or post, is a decisive success factor in direct marketing campaigns. Knowing which customers should be addressed prior to a campaign saves wastage and leads to higher completion rates.
While dummy models only deliver random results, a significantly more reliable value is achieved with the use of artificial neural networks.
Personalization drives purchase completion rates.
While recommender systems provide personalized recommendations on demand (when visiting the website) or for all customers, specific customer segments are selected for direct marketing campaigns who are to receive a specific offer. With predictive analytics, it is possible to forecast the likelihood of completion for each individual lead.
Choosing the right customers.
The data science process can be demonstrated using an open data set from a Portuguese bank. (S. Moro, P. Cortez and P. Rita. A Data-Driven Approach to Predict the Success of Bank Telemarketing. Decision Support Systems (2014))
There are 41,188 data records from a tele-marketing campaign. The addressed customers are suggested to make a time deposit. The data records contain various variables, such as age, gender, job, family status, education, information about previous loans, the number and time of previous contacts, as well as exogenous factors such as the 3-month Euribor, the monthly employment figures or the consumer price Index.
The target variable 'y' takes on the values 1 (customer has made the time deposit) and 0 (not made).
Our approach:
To evaluate how well different algorithms perform on this data set, we divide it into 2 parts, the training data set (80% of the data) and the test data set (20% of the parts). Categorical data such as gender, occupation and education are converted into 0 and 1 using “One hot encoding” (e.g., the column Marital with 4 values in 4 columns is 'marital_divorced', 'marital_married', 'marital_single', 'marital_unknown' each with one 1 transformed for the relevant feature)
The numerical values are scaled so that they now take on values in the range between 0 and 1. Various algorithms are then trained with the training data set, forecasts are generated with the input values of the test data set and various classification metrics are calculated. To evaluate whether the models are usable, we compare them with 3 dummy benchmark models: a. All buy, b. Nobody buys and a random model.
Since our data set shows a class imbalance (30% buyers in the test), we measure the performance with the so-called ROC_AUC Score
(https://en.wikipedia.org/wiki/Receiver_operating_characteristic).
This measures the efficiency as a function of the error rate. A value close to 50% indicates a random model, a value close to 100% is perfect (and too good to be true). Values between 70% and 80% are acceptable and values between 80% and 90% indicate excellent discernment of the model.
IMPORTANT!
It should also be demonstrated here that so-called data leakage can very easily occur in real applications. It must always be guaranteed that only the information that is actually available at the time of a forecast is used as an input.
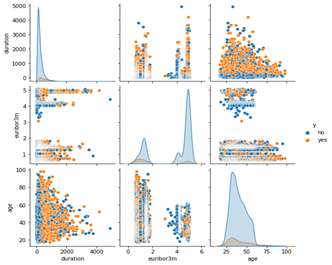
Figure 1: Example of visual analytics in the bank marketing data set. Orange data points show completed purchases, blue points no purchases.
If you use data visualizations to show the values of the individual characteristics or pairs of variables and color those customers who have not completed the deal blue or those who have completed the deal orange, then you immediately see that both classes are largely on top of each other. This is problematic if no algorithms are available because it is difficult for a business analyst to decide based on the characteristic values how high the probability is that a given customer will complete a purchase.
The result:
Our dummy models all have scores at 49% - 51%, as expected. A logistic regression achieves 81.9% and a Random Forrest Classifier 82.5% and are therefore very good. But if we look at the importance of the input characteristics, then we see that the characteristic “duration” is in 1st position. Duration shows the time of the telephone conversation with the customer and is known after the campaign has been carried out. In addition, this feature correlates with the class no purchase, because if the call duration is 0, no purchase is made.
Therefore, this characteristic may not be used as an input at all. If it is removed and the training is repeated with the same models, the best model we get is a neural network with 2 layers, which achieves a score of 73.1 percent. That is lower than before, but still in the acceptable range and significantly higher than chance.
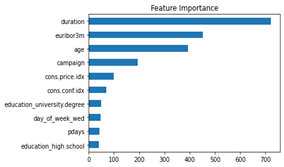
Figure 2: Feature Importance of the Random Forrest with all features (Top 10) are shown.
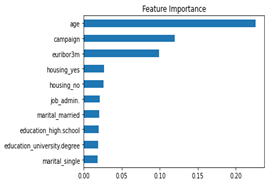
Figure 3: Feature importance after removing the duration and retraining.